I spent a long time GPU-accelerating the Triton VM zk-STARK prover — taking a prover that normally runs CPU-bound in Rust and moving the entire pipeline onto a single NVIDIA RTX PRO 6000 Blackwell in C++/CUDA. The hardware: 96 GB GDDR7, SM 10.0, a professional Blackwell workstation card with the memory headroom that zk proving demands. The codebase: 245 hand-written CUDA kernels, every one of them benchmarked and profiled before being called done. The constraint: output bit-for-bit identical to the reference Rust prover, kernel-by-kernel and end-to-end.
The cryptography was the excuse; the real education was in performance engineering. These are the seven lessons that work drilled into me — most of them contradicting the advice I started with.
Table of contents
Open Table of contents
- The project: GPU-accelerating a zk-STARK prover
- 1. Profile first — always — before you touch the code
- 2. Put more on the GPU than the textbook says
- 3. Watch memory and bandwidth like a hawk
- 4. Overlap CPU and GPU work asynchronously
- 5. Optimize the CPU side too
- 6. Drop to PTX in the hottest kernels
- 7. Registers are the fastest memory — use them
- The through-line
The project: GPU-accelerating a zk-STARK prover
A note on scope: this is GPU-acceleration and high-performance-computing work in zero-knowledge cryptography — it is not AI-inference work. I include it because the performance-engineering lessons carry straight over to inference, and because it shows GPU acceleration well beyond machine learning. (My inference projects live on the projects page.)
What a zk-STARK is. A zk-STARK is a proof that a computation was performed correctly — one that anyone can verify in milliseconds without re-running the computation. Triton VM is a zero-knowledge virtual machine: run a program on it, and out comes the program’s output plus a STARK proving it really produced that output.
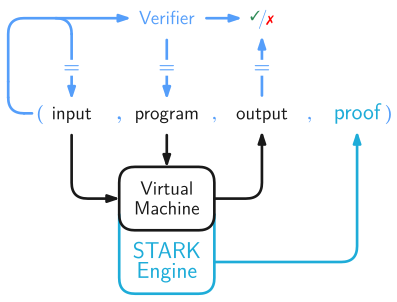
(input, program, output, proof) tuple without re-executing. Diagram from the Triton VM specification.The workload — and why it’s nothing like a neural network. Generating the proof is the expensive part, and its shape is very different from ML inference. The prover takes the program’s execution trace — a large table of finite-field integers — and pushes it through a fixed pipeline:
- Low-degree extension: blow the trace up 8× and evaluate enormous polynomials — a sea of number-theoretic transforms (the NTT, an FFT over a finite field).
- Commitment: hash millions of table rows into Merkle trees.
- FRI: recursively fold the result in half to prove it’s a low-degree polynomial.
So instead of dense matrix multiplies in FP16, the work is 64-bit modular integer arithmetic, butterfly-network transforms, and mass hashing — embarrassingly parallel in places, latency- and bandwidth-bound in others. A great GPU target, and a brutal one.
What I built. I moved the entire pipeline onto a single RTX PRO 6000 Blackwell in C++/CUDA — 245 hand-written CUDA kernels covering every stage from trace extension through FRI folding to Merkle commitment. Every kernel was written, profiled with Nsight Compute, and rewritten at least once before the codebase was considered stable. The RTX PRO 6000’s 96 GB GDDR7 was the decisive hardware choice: the prover holds its entire working set resident in VRAM (112 GB logical, managed with unified memory oversubscription) and never pages back to host for a stage boundary. You can see it alongside my inference work on the projects page.
Everything below is what building those 245 kernels taught me about performance — I’ll keep the cryptography to a minimum and stay on the optimization.
1. Profile first — always — before you touch the code
The single most expensive habit in GPU work is changing code on a hunch. Blind edits optimize things that don’t matter and hide the things that do. I have thrown away days of work because I assumed I knew where the bottleneck was before measuring it.
The discipline is: Nsight Systems first, for the system-level timeline — where is the time actually going across CPU, GPU, PCIe transfers, and the gaps in between? It immediately exposes the real shape of the workload: which stages are kernel-bound, which are waiting on host-to-device copies, where synchronization barriers are stalling the timeline. On the zk prover, Nsight Systems revealed that the first version spent roughly 30% of wall time in host–device synchronization between stages — a problem that no amount of kernel optimization would have fixed.
Once the hot kernels are identified, Nsight Compute goes deeper: the Memory Workload Analysis section breaks down L1/L2 hit rates and DRAM bandwidth utilization; the Warp State Statistics show exactly why warps are stalling (memory dependency vs. long-scoreboard vs. no instruction fetch vs. wait on barrier); the Occupancy section shows how launch configuration and register pressure trade off. On Blackwell, the SM architecture is different enough from Ampere that Turing-era intuitions about warp occupancy are actively misleading — the profiler, not your mental model, decides what to fix. Fix the top bottleneck, re-profile, because the bottleneck always moves. Find, fix, find the next one, fix. The profiler decides the work order; I don’t.
2. Put more on the GPU than the textbook says
The textbook split — keep the data-parallel work on the GPU, push the branchy and irregular work to the CPU — was flat wrong for my workloads. I started with a careful partitioning: smooth, regular kernels on the GPU, irregular tree traversals and control logic on the CPU. Profiling the result showed the CPU was dominating wall time through PCIe round-trips for data that was already on the GPU.
Moving everything onto the GPU — branches and all — came out roughly 5× faster than the careful partition. The reason is that the PCIe cost of a host–device round-trip for a 64-byte control decision dwarfs the cost of running a few divergent warps. Modern Blackwell silicon handles complicated, divergent workloads far better than the old mental model assumes: the branch prediction is more aggressive, the warp scheduler hides latency more effectively at high occupancy, and the SM’s instruction-level parallelism handles mixed compute and memory stalls better than Turing-generation hardware did.
The practical rule I landed on: if the data for a decision already lives in VRAM, keep the decision on the GPU. Only let the CPU drive work when it genuinely needs host-side information that would cost more to push to the device than to evaluate on the host.
3. Watch memory and bandwidth like a hawk
Kernel compute speed is only half the game, and it’s often not the binding half. I ran a 112 GB logical working set on a 96 GB GPU using CUDA unified memory — the prover’s trace tables, NTT buffers, Merkle hash buffers, and FRI folding state all live in VRAM at once, managed with cudaMallocManaged and explicit prefetch hints. At that oversubscription ratio, the system is bound by migration and PCIe bandwidth, not FLOPs.
The unlock came from memory discipline, not faster kernels: trimming buffer lifetimes so GPU allocations are freed immediately when a stage finishes (letting the CUDA runtime reclaim physical pages before the next stage needs them), ordering stages so that the largest buffers don’t all need to be resident simultaneously, and using cudaMemAdvise(cudaMemAdviseSetPreferredLocation, ...) aggressively to pin the hot working set to the device. The combination delivered another ~2× on end-to-end proof time — with zero kernel changes.
At the scale of 96 GB GDDR7, the memory bandwidth of the RTX PRO 6000 (the Blackwell GDDR7 bus is substantially wider than GDDR6X at the same capacity tier) means that a bandwidth-bound kernel runs meaningfully faster than it would on an equivalent Ampere card. But it also means the bandwidth budget is large enough to waste: a kernel that touches memory it doesn’t need still pays a real cost. Watch every access, every transfer, every link — VRAM bandwidth, PCIe bandwidth, system RAM — not just FLOPs.
4. Overlap CPU and GPU work asynchronously
Even when all the heavy compute lives on the GPU, the CPU is not idle real estate. The CPU is running the Rust host driver, orchestrating kernel launches, and feeding the CUDA stream with work. In the naive version of the prover, the CPU and GPU took turns: CPU prepares stage N input → launch kernels → CPU waits for completion → CPU prepares stage N+1 input → repeat.
After studying the Nsight Systems timeline carefully, I restructured the pipeline around CUDA streams and async host–device work: the CPU starts preparing stage N+1 while GPU kernels for stage N are still running, using host-accessible mapped memory for the handoff and CUDA events for synchronization. The CPU does genuinely useful work — Merkle tree root accumulation, FRI query sampling, proof serialization — in the shadow of GPU execution rather than waiting on the GPU’s completion callback.
“Everything on the GPU” (lesson 2) and “use the CPU effectively” are not in conflict — they’re both true once the two run concurrently instead of taking turns. The key is studying the actual timeline, not guessing at the overlap: Nsight Systems shows the CPU thread timeline alongside the CUDA stream timeline so you can see exactly where the host is blocking and where it’s doing useful work.
5. Optimize the CPU side too
The GPU is only as fast as what feeds it. On the zk prover the host path was serialized Rust code — field-element serialization, proof accumulation, transcript hashing — and in early profiling it was adding measurable latency between GPU stages.
The fix on the C++ host side was oneTBB for parallel host work: its work-stealing task scheduler kept every host core busy with field-element preparation and intermediate result accumulation while the GPU ran. The benefit wasn’t that the CPU was fast enough to compete with the GPU — it isn’t — but that it was fast enough to not be the bottleneck feeding the GPU. A fast GPU fed by a slow, serial CPU is a fast GPU that waits. tbb::parallel_for over the host-side preparation loops, tbb::parallel_pipeline for the multi-stage host work, and work-stealing for anything with irregular task sizes.
6. Drop to PTX in the hottest kernels
When a kernel is the bottleneck and the NVCC compiler won’t emit the instructions you need, drop to inline PTX. NVIDIA’s virtual ISA is stable across Blackwell, and a handful of PTX instructions are either unavailable in C++ or require specific intrinsics that the compiler won’t reliably generate from idiomatic code.
In the zk prover, the inner loop of every NTT butterfly stage is a 64-bit modular multiply — a 64×64→128-bit widening multiply followed by a Barrett or Montgomery reduction. NVCC will not generate a mul.hi.u64 (the high 64 bits of a 64×64 multiply) from C++ without a platform intrinsic; __umul64hi() works but the compiler often reorders it in ways that break the carry chain. Inline PTX gives exact control:
uint64_t lo, hi;
asm("mul.lo.u64 %0, %1, %2;" : "=l"(lo) : "l"(a), "l"(b));
asm("mul.hi.u64 %0, %1, %2;" : "=l"(hi) : "l"(a), "l"(b));
Other PTX wins in the prover: lop3.b32 for fused 3-input logic in the Merkle hash inner loop (replaces three separate AND/XOR/OR instructions with one), prmt for byte-lane permutation in hash state packing, and explicit mad.lo.u64 / mad.hi.u64 to control the multiply-add carry chain. Each of these is a micro-optimization — individually 5–10% — but on a kernel that runs millions of times per proof, they compound.
The discipline: PTX only in kernels the profiler identifies as the bottleneck, and only for the specific instruction sequences NVCC is failing to generate. For everything else, NVCC on Blackwell is a good compiler. The cost of inline PTX is maintainability; the payoff has to earn that cost.
7. Registers are the fastest memory — use them
The register file on each Blackwell SM is the fastest storage on the GPU — significantly faster than shared memory, orders of magnitude faster than L2 or GDDR7. In theory this is obvious; in practice, most kernel code leaves performance on the table by fetching values from shared memory or L2 that it could have kept in registers across iterations.
The technique is register blocking: instead of loading a value, using it, storing it, and reloading it next iteration, load it once and keep it in a register variable across all the iterations that use it. For the NTT butterfly, this means keeping the twiddle factor and the two butterfly operands in registers across the full butterfly computation rather than reloading from shared memory mid-butterfly. For the FRI folding kernel, it means keeping the running fold accumulator in a register rather than reading it back from a global buffer on each step.
The catch is the register budget: each Blackwell SM has a fixed register file, and using more registers per thread reduces the number of warps the SM can schedule simultaneously (occupancy). The practical limit varies by kernel — kernels that are latency-bound (many memory stalls) benefit from high occupancy because more warps give the scheduler more to hide latency with; kernels that are compute-bound (the NTT butterfly inner loop) benefit from the register blocking even at lower occupancy. The tool for navigating this tradeoff is Nsight Compute’s Register and Spill Analysis section combined with -Xptxas -v to see per-kernel register counts and spill counts. The goal is maximum useful register residency without spilling to local memory — spills go to L2 or GDDR7 and undo everything you were trying to accomplish.
On the zk prover, the single biggest single-kernel speedup in the whole project came from aggressive register blocking on the NTT butterfly kernel: 3× throughput improvement on a kernel that was already the hottest stage, just from keeping 8 operands in registers across the butterfly rather than touching shared memory per step.
The through-line
245 kernels, one GPU, bit-for-bit correctness. The hardware was a Blackwell RTX PRO 6000 — 96 GB GDDR7, SM 10.0, a card designed for exactly this kind of large-working-set professional compute. The lessons aren’t Blackwell-specific, but Blackwell did change the calculus on a few of them: its divergence handling is genuinely better (lesson 2), its GDDR7 bandwidth rewards bandwidth-aware design more aggressively (lesson 3), and its register file is large enough to enable blocking strategies that would have spilled on older hardware (lesson 7).
Don’t trust defaults — not the textbook, not your own first instinct, not last year’s hardware. Profile, measure, and let the numbers surprise you. Porting a whole zk-STARK prover to the GPU was less about cryptography than about asking, at every stage, where is the time really going — and being willing to throw out what I thought I knew.